Android統計チャート MPAndroidChart
Android統計チャート MPAndroidChart
MPAndroidChartはAndroidプラットフォーム上のオープンソースのサードパーティ統計チャートライブラリで、一般的な折れ線グラフ、円グラフ、棒グラフ、散布図、金融株で使用される蝋燭チャート、バブルチャート、レーダー統計円グラフなど、複雑で豊富なスタイルの各種統計チャートを描画することができます。つまり、AndroidMPChartは、Androidプラットフォームで日常的に行われる統計チャート開発のニーズを基本的に満たすことができます。
AndroidMPChartのgithubでのプロジェクトページです。
https://github.com/PhilJay/MPAndroidChart
MPAndroidChartは、公開されているjarパッケージを自分のプロジェクトのlibsにインポートして使用することができます。MPAndroidChartの公開jarパッケージのページはこちらです。
https://github.com/PhilJay/MPAndroidChart/releases
AndroidMPChartの使用方法。上記リリースページから最新のjarパッケージをダウンロードし、自分のプロジェクトのlibsにコピーして使用します。画像のように
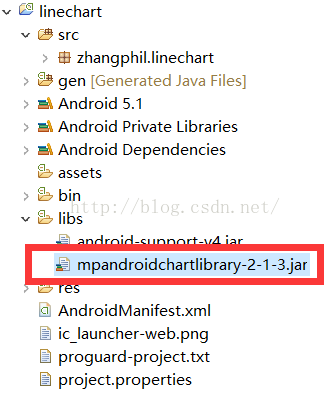
注:この記事はMPAndroidChartのバージョン:mpandroidchartlibrary-2-1-3.jarを元に書いています。
さて、まずAndroidMPChartの基本である折れ線グラフを作ってみましょう。折れ線グラフは通常の統計グラフで最もよく使われますが、AndroidMPChartは豊富な機能でサポートしています。
レンダリングは以下のようになります。
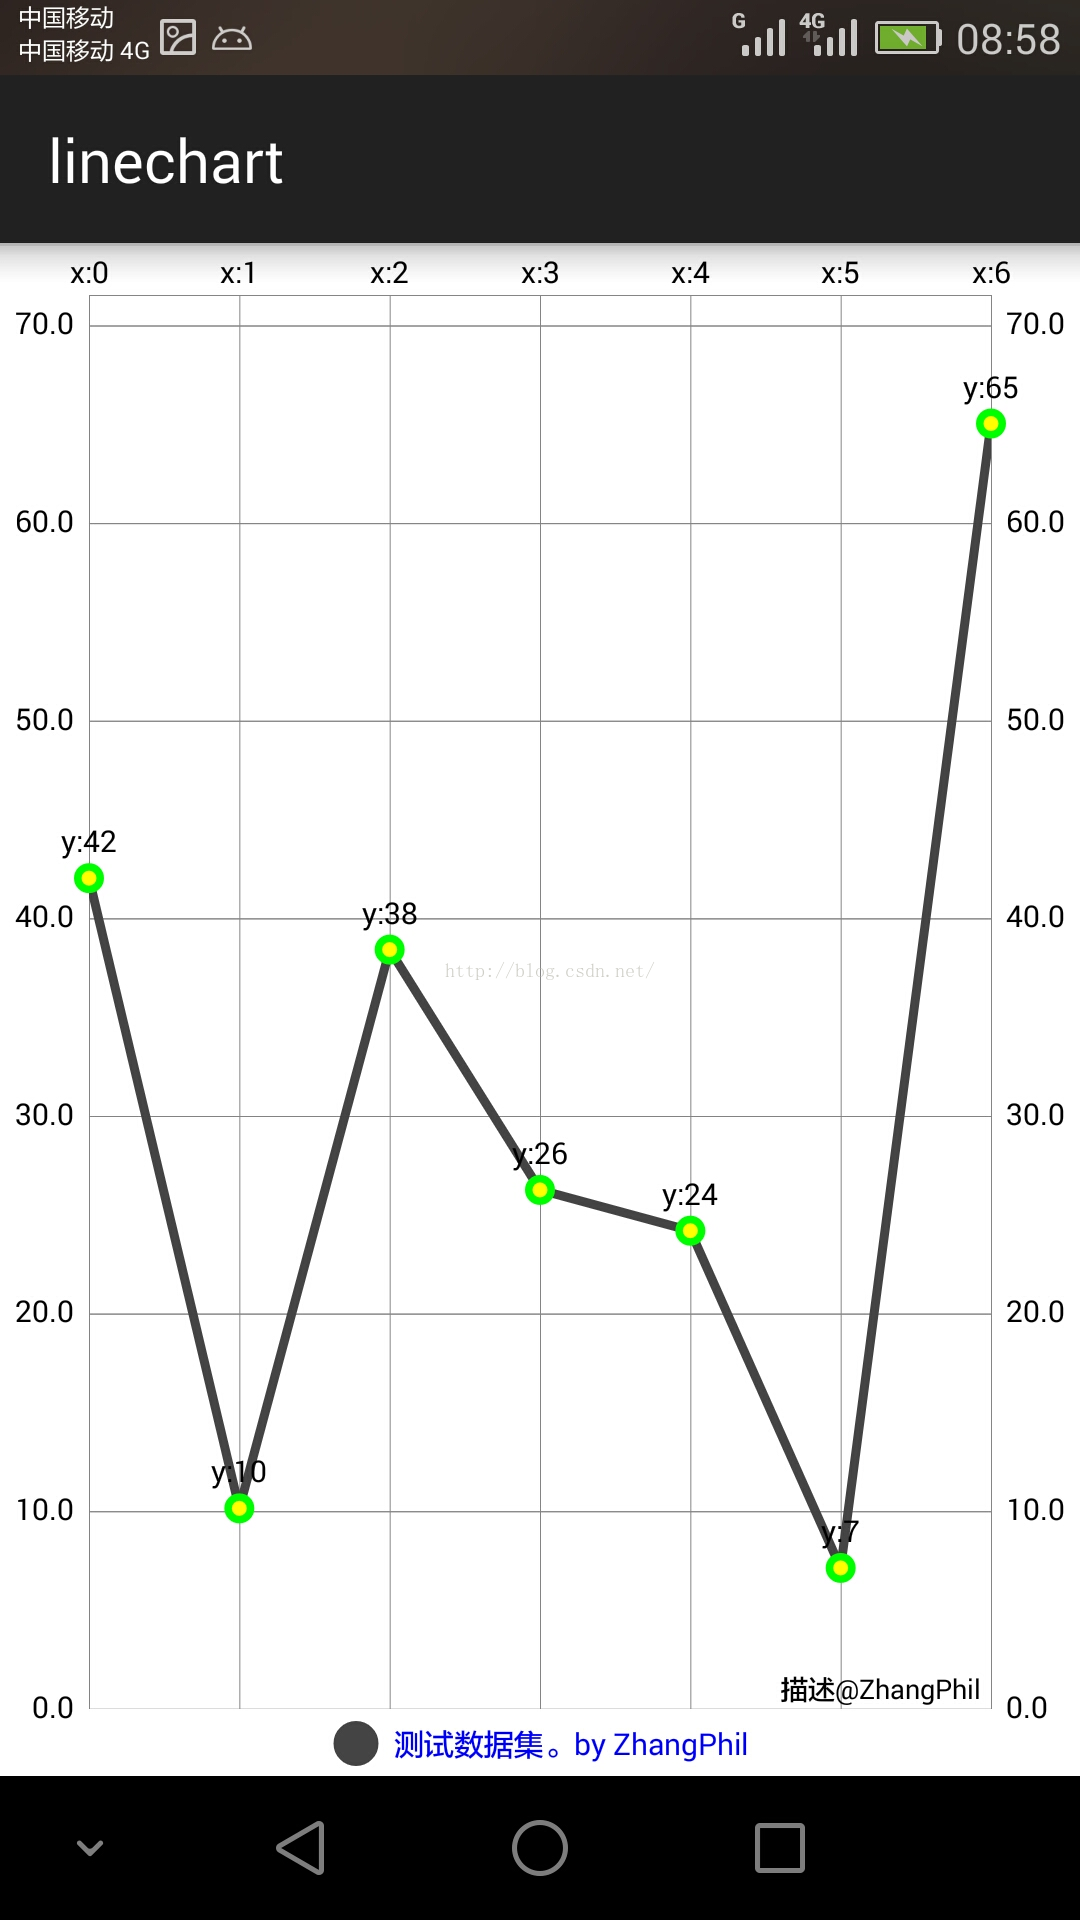
上記の統計図表を実装するための完全なコードを示す。
MainActivity.javaのコードです。
package zhangphil.linechart;

import java.util.ArrayList;

import com.github.mikephil.charting.charts.LineChart;
import com.github.mikephil.charting.components;
import com.github.mikephil.charting.components.Legend.LegendForm;
import com.github.mikephil.charting.components.Legend.LegendPosition;
import com.github.mikephil.charting.data.Entry;
import com.github.mikephil.charting.data.LineData;
import com.github.mikephil.charting.data.LineDataSet;
import com.github.mikephil.charting.utils.ValueFormatter;

import android.support.v7.app.ActionBarActivity;
import android.graphics.Color;
import android.os.Bundle;

public class MainActivity extends ActionBarActivity {

	@Override
	protected void onCreate(Bundle savedInstanceState) {
		super.onCreate(savedInstanceState);
		setContentView(R.layout.activity_main);

		LineChart chart = (LineChart) findViewById(R.id.chart);

		// make 7 data points (along x coordinate axis)
		LineData mLineData = makeLineData(7);
		setChartStyle(chart, mLineData, Color.WHITE);
	}

	// Set the style of the chart display
	private void setChartStyle(LineChart mLineChart, LineData lineData,
			int color) {
		// Whether to add a border to the line chart
		mLineChart.setDrawBorders(false);

		mLineChart.setDescription("Description@ZhangPhil"); // Data description

		// If there is no data, this will be displayed, similar to the emtpyview of listview
		mLineChart
				.setNoDataTextDescription("If the data passed to MPAndroidChart is empty, then you will see this text. @Zhang Phil");

		// Whether to draw the background color.
		// If mLineChart.setDrawGridBackground(false), the
		// Then mLineChart.setGridBackgroundColor(Color.CYAN) will not work;
		mLineChart.setDrawGridBackground(false). mLineChart.setDrawGridBackground(false);
		mLineChart.setGridBackgroundColor(Color.CYAN);

		// Touch
		mLineChart.setTouchEnabled(true);

		// Drag and drop
		mLineChart.setDragEnabled(true);

		// Zoom
		mLineChart.setScaleEnabled(true);

		mLineChart.setPinchZoom(false);

		// Set the background
		mLineChart.setBackgroundColor(color);

		// Set the data of x,y axis
		mLineChart.setData(lineData);

		// Set the scale chart marker, which is the set of y value's
		Legend mLegend = mLineChart.getLegend();

		mLegend.setPosition(LEGENDPosition.BELOW_CHART_CENTER);
		mLegend.setForm(LegendForm.CIRCLE);// style
		mLegend.setFormSize(15.0f);// font
		mLegend.setTextColor(Color.BLUE);// color

		// Animation along x-axis, time 2000 ms.
		mLineChart.animateX(2000);
	}

	/**
	 * @param count
	 * The number of data points.
	 * @return
	 */
	private LineData makeLineData(int count) {
		ArrayList<String> x = new ArrayList<String>();
		for (int i = 0; i < count; i++) {
			// The data displayed on the x-axis
			x.add("x:" + i);
		}

		// The data for the y-axis
		ArrayList<Entry> y = new ArrayList<Entry>();
		for (int i = 0; i < count; i++) {
			float val = (float) (Math.random() * 100);
			Entry entry = new Entry(val, i);
			y.add(entry);
		}

		// y-axis data set
		LineDataSet mLineDataSet = new LineDataSet(y, "test dataset. by ZhangPhil");

		// Use the y-axis set to set the parameters
		// Line width
		mLineDataSet.setLineWidth(3.0f);

		// size of the displayed circle
		mLineDataSet.setCircleSize(5.0f);

		// color of the folded line
		mLineDataSet.setColor(Color.DKGRAY);

		// color of the round ball
		mLineDataSet.setCircleColor(Color.GREEN);

		// After setting mLineDataSet.setDrawHighlightIndicators(false)
		// Highlight's cross-hatched vertical and horizontal lines will not be displayed.
		// Also, mLineDataSet.setHighLightColor(Color.CYAN) is disabled.
		mLineDataSet.setDrawHighlightIndicators(true);

		// Color of the crosshairs after a click
		mLineDataSet.setHighLightColor(Color.CYAN);

		// Set the font size of the data points displayed on this item.
		mLineDataSet.setValueTextSize(10.0f);

		// mLineDataSet.setDrawCircleHole(true);

		// Change the dash style with a curve.
		// mLineDataSet.setDrawCubic(true);
		// default is a straight line
		// The smoothness of the curve, the bigger the value the smoother it is.
		// mLineDataSet.setCubicIntensity(0.2f);

		// Fill the area below the curve, red, semi-transparent.
		// mLineDataSet.setDrawFilled(true);
		// mLineDataSet.setFillAlpha(128);
		// mLineDataSet.setFillColor(Color.RED);

		// Fill the color of the data points on the line, the center blank space wrapped inside the circle.
		mLineDataSet.setCircleColorHole(Color.YELLOW);

		// Set the format of the data displayed on the line. If not set, the float data format will be displayed by default.
		mLineDataSet.setValueFormatter(new ValueFormatter() {

			@Override
			public String getFormattedValue(float value) {
				int n = (int) value;
				String s = "y:" + n;
				return s;
			}
		});

		ArrayList<LineDataSet> mLineDataSets = new ArrayList<LineDataSet>();
		mLineDataSets.add(mLineDataSet);

		LineData mLineData = new LineData(x, mLineDataSets);

		return mLineData;
	}
}
activity_main.xmlに必要なMainActivity.java。
<RelativeLayout xmlns:android="http://schemas.android.com/apk/res/android"
    xmlns:tools="http://schemas.android.com/tools"
    android:layout_width="match_parent"
    android:layout_height="match_parent" >

	<com.github.mikephil.charting.charts.LineChart
        android:id="@+id/chart"
        android:layout_width="match_parent"
        android:layout_height="match_parent" />

</RelativeLayout>
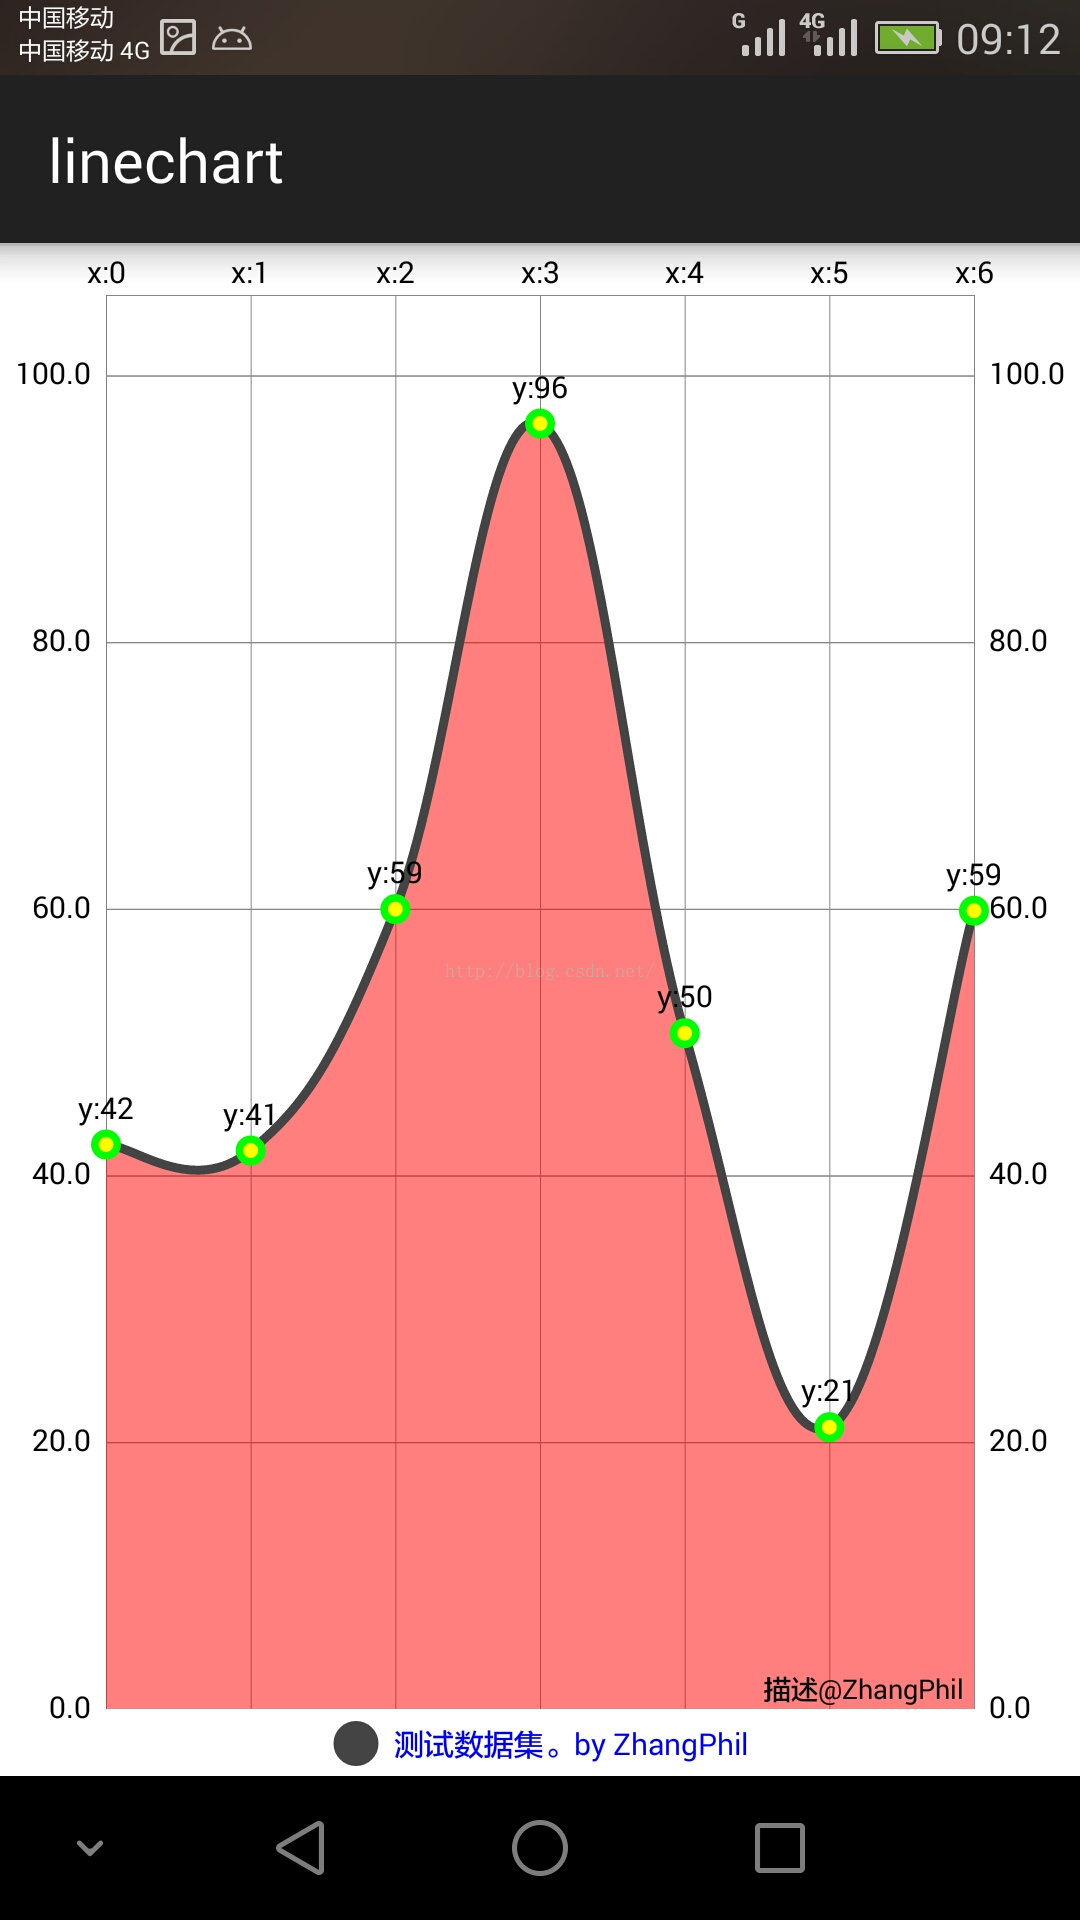
MPAndroidChartは豊富なパラメータ設計条件を提供し、例えばこの例ではコメントアウトされたこのコードを再有効化すれば、スタイル豊かな統計チャートを設計することができます。
// Change the dash style to use curves.
		// mLineDataSet.setDrawCubic(true);
		// default is straight line
		// The smoothness of the curve, the larger the value the smoother it is.
		// mLineDataSet.setCubicIntensity(0.2f);

		// Fill the area below the curve, red, semi-transparent.
		// mLineDataSet.setDrawFilled(true);
		// mLineDataSet.setFillAlpha(128);
		// mLineDataSet.setFillColor(Color.RED);
そうすると、折れ線グラフは次のようになります。
関連
-
Android のリストビューでアダプタを使用しているときに null オブジェクトの参照に対して仮想メソッド xxxxxxxx を呼び出そうとする問題が解決されました。
-
アンドロイド アルメアビ アルメアビ-v7a
-
Androidでコンストラクタのインテントを解決できない原因と解決策
-
スレッド内にハンドラを作成できない Looper.prepare() を呼び出していないスレッド
-
Android Studioの解決策:xxxは囲むクラスではありませんエラー
-
エラーの報告です。ArrayAdapter は、リソース ID が TextView である必要があります。
-
Android Studioで「Error:SSL peer shut down incorrectly」というエラーが表示される。
-
Eclipse &プラグインのよくある使用エラーとコンパイルエラー
-
アプリケーションがメインスレで仕事をしすぎている可能性がある
-
Android 開発の問題点:ActivityNotFoundException: 明示的なアクティビティクラスを見つけることができません
最新
-
nginxです。[emerg] 0.0.0.0:80 への bind() に失敗しました (98: アドレスは既に使用中です)
-
htmlページでギリシャ文字を使うには
-
ピュアhtml+cssでの要素読み込み効果
-
純粋なhtml + cssで五輪を実現するサンプルコード
-
ナビゲーションバー・ドロップダウンメニューのHTML+CSSサンプルコード
-
タイピング効果を実現するピュアhtml+css
-
htmlの選択ボックスのプレースホルダー作成に関する質問
-
html css3 伸縮しない 画像表示効果
-
トップナビゲーションバーメニュー作成用HTML+CSS
-
html+css 実装 サイバーパンク風ボタン
おすすめ
-
[android.os.NetworkOnMainThreadException を解決してください。
-
Android プロジェクトのライブラリに armeabi-v7a、armeabi、x86 が追加されました。
-
AndroidStudioのコンパイル時のエラーを解決します。構成 ':classpath' のすべてのアーティファクトを解決できませんでした。
-
指定された子にはすでに親がいます。まず、その子の親に対して removeView() をコールする必要があります。
-
Androidです。GridViewコントロールの使用
-
Android ProgressBar解説 ProgressBarの色を変更する
-
Androidアプリ】【形状利用概要
-
Android Studioのヒント - これを読めば、すべてのヒントが役に立つ
-
Android Studioのインポートプロジェクトが表示されます。ファイルをクランチするのに失敗しました
-
ARMアセンブリ共通命令 NULL演算 NOP命令