天気がわからない?Pythonと一緒に這い上がって、お天気データ解析を教えてあげよう
前文
今日は、天気データを取得して視覚化し、天気のビジュアルツアーに参加する小さな例を紹介します。
I. コア機能設計
全体としては、まず中国天気社の天気データをクロールし、csvファイルとして保存し、このデータを表示して視覚的に分析する必要があります。
要件を分解すると、以下のステップで達成すべきことがおおよそ整理できます。
- 中国気象から7.20-7.21の雨量データをクローラーで取得し、以下を含む。 都市名、風向、風量、降水量、相対湿度、大気質 .
- 取得した気象データを前処理し、河南省の風向・風速を解析し、プロットする。 風向風速レーダーマップ .
- 取得した温度と湿度をプロットする 温度と湿度の相関分析グラフ 温度と湿度の比較解析のために
- 得られた各都市の降雨量をもとに、可視化する。 過去24時間の時間帯別降水量 .
- プロット 各都市の24時間累積降水量 .
II. 実装手順
1. データをクロールする
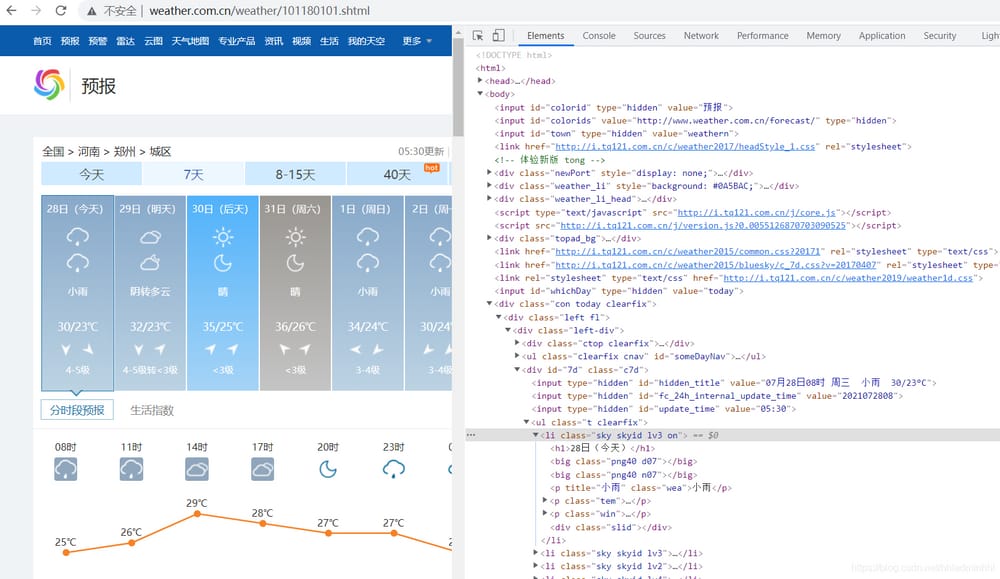
まず、各都市の雨量データを取得する必要があるのですが、中国天気のURLを解析したところ、http://www.weather.com.cn/weather/101180101.shtml ということがわかりました。
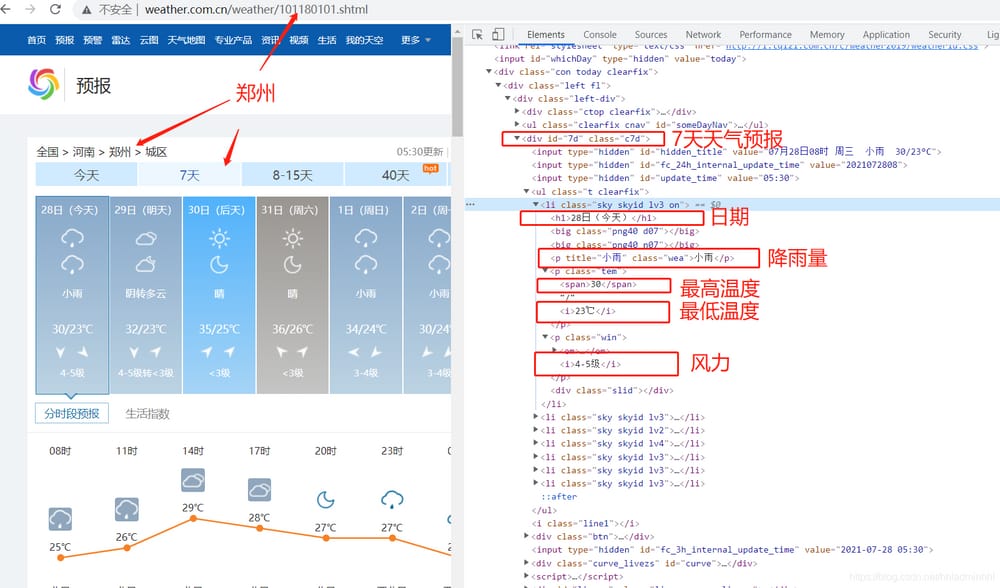
json形式で返されるデータを分析した結果、以下のことがわかります。
- 101180101 は都市番号
- の7日間天気予報データ情報は divタグとid="7d"を使用しています。
- 日付、天気、気温、風量などはulタグとliタグに
以上、ページの構造を分析したことで、クロールに必要なデータを手に入れることができるようになりました。すべてのデータリソースを取得した後、このデータを保存することができます。
依頼するサイト
http://www.weather.com.cn/weather/101180101.shtml のWeather.com。別の地域をクロールしたい場合は、最後の101180101地域番号を変更するだけで、その前にある天気は7日間のページであることを意味します。
def getHTMLtext(url):
	"""Request to get the content of the page"""
	try:
		r = requests.get(url, timeout = 30)
		r.raise_for_status()
		r.encoding = r.apparent_encoding
		print("Success")
		return r.text
	except:
		print("Fail")
		return" "
<イグ
加工データです。
BeautifulSoupライブラリを使って、先ほど取得した文字列からデータを抽出します。必要な風向、風量、降水量、相対湿度、大気質などを取得します。
def get_content(html,cityname):
	"""Process to get useful information to save the data file"""
	final = [] # initialize a list to save the data
	bs = BeautifulSoup(html, "html.parser") # Create BeautifulSoup object
	body = bs.body
	data = body.find('div', {'id': '7d'}) # find the div tag and id = 7d
	# Crawl the following data for the day
	data2 = body.find_all('div',{'class':'left-div'})
	text = data2[2].find('script').string
	text = text[text.index('=')+1 :-2] # remove change var data= to turn it into json data
	jd = json.loads(text)
	dayone = jd['od']['od2'] # find the day's data
	final_day = [] # store the day's data
	count = 0
	for i in dayone:
		temp = []
		if count <=23:
			temp.append(i['od21']) # add time
			temp.append(cityname+'city') # add city
			temp.append(i['od22']) # add the temperature at the current moment
			temp.append(i['od24']) # add the wind direction at the current moment
			temp.append(i['od25']) # add the wind level at the current moment
			temp.append(i['od26']) # add the amount of precipitation at the current moment
			temp.append(i['od27']) # add the relative humidity at the current moment
			temp.append(i['od28']) # add the current moment of control quality
# print(temp)
			final_day.append(temp)
			data_all.append(temp)
		count = count + 1
	# crawl the following 24h data
	ul = data.find('ul') # find all the ul tags
	li = ul.find_all('li') # find the left and right li tags
	i = 0 # control the number of days to crawl
	for day in li: # iterate through every li found
	    if i < 7 and i > 0:
	        temp = [] # Temporarily store the data for each day
	        date = day.find('h1').string # get the date
	        date = date[0:date.index('day')] # fetch the date number
	        temp.append(date)
	        inf = day.find_all('p') # find the p tags under li, extract the value of the first p tag, i.e. weather
	        temp.append(inf[0].string)

	        tem_low = inf[1].find('i').string # find the lowest temperature

	        if inf[1].find('span') is None: # The weather forecast may not have a maximum temperature
	            tem_high = None
	        else:
	            tem_high = inf[1].find('span').string # find the highest temperature
	        temp.append(tem_low[:-1])
	        if tem_high[-1] == '°C':
	        	temp.append(tem_high[:-1])
	        else:
	        	temp.append(tem_high)

	        wind = inf[2].find_all('span') # find wind direction
	        for j in wind:
	        	temp.append(j['title'])

	        wind_scale = inf[2].find('i').string # find wind scale
	        index1 = wind_scale.index('level')
	       	temp.append(int(wind_scale[index1-1:index1]))
	        final.append(temp)
	    i = i + 1
	return final_day,final
都市の天気データが得られたので、同様に河南省の各県レベルの都市の天気データを、異なる市外局番に基づいて取得することができます。
Citycode = { "Zhengzhou": "101180101",
             "Xinxiang": "101180301",
             "Xuchang": "101180401",
             "Pingdingshan": "101180501",
             "Xinyang": "101180601",
             "Nanyang": "101180701",
             "Kaifeng": "101180801",
             "Luoyang": "101180901",
             "Shangqiu": "101181001",
             "Jiaozuo": "101181101",
             "Hebi": "101181201",
             "Puyang": "101181301",
             "Zhoukou": "101181401",
             "Luohe": "101181501",
             "Zhumadian": "101181601",
             "Sanmenxia": "101181701",
             "JiYuan": "101181801",
             "Anyang": "1011
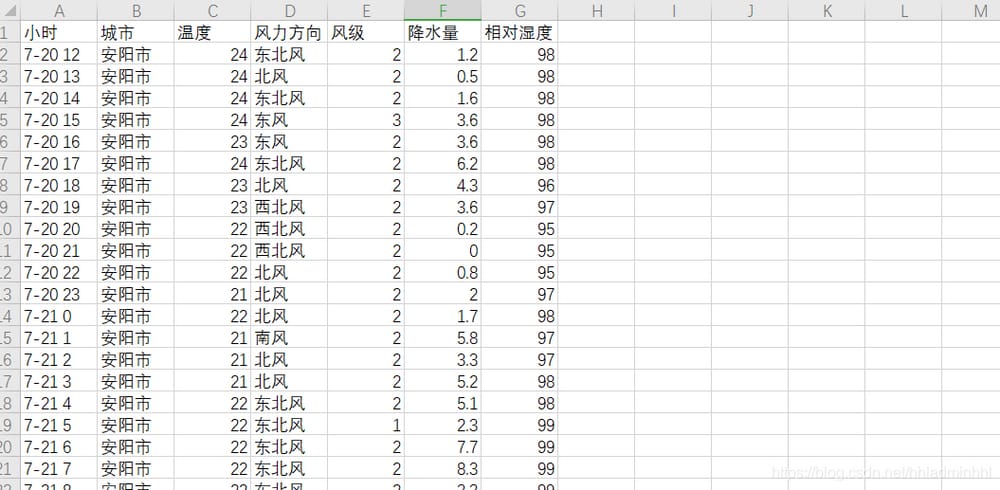
データを保存する。
def write_to_csv(file_name, data, day=14):
	"""Save as csv file"""
	with open(file_name, 'a', errors='ignore', newline='') as f:
		if day == 14:
			header = ['date','city','weather','min_temp','max_temp','wind_1','wind_2','wind_level']
		else:
			header = ['hour','city','temperature','wind direction','wind level','precipitation','relative humidity','air quality']
		f_csv = csv.writer(f)
		f_csv.writerow(header)
		f_csv.writerows(data)
write_to_csv('Henan Weather.csv',data_all,1)
これにより、都道府県レベルの各都市の天気データを保存することができる。
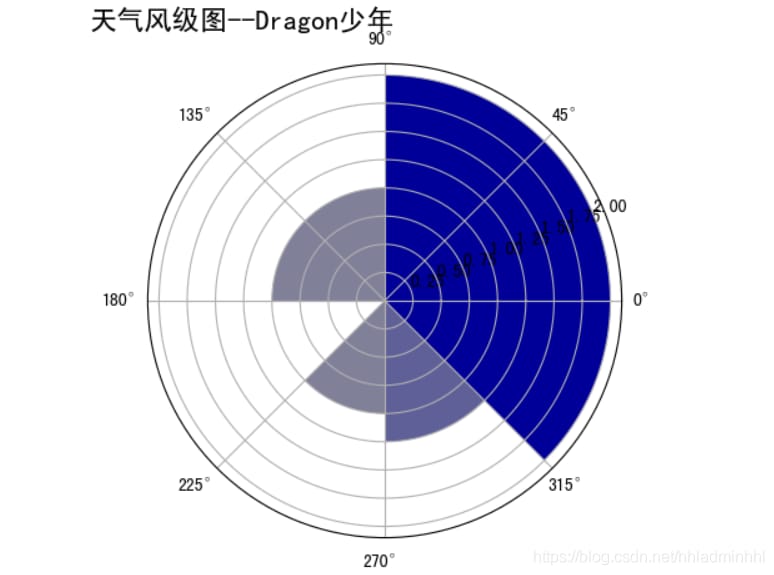
2. 風向風速レーダーマップ
を使用した風と風向としての県内の統計情報 極座標 極座標で示した方がわかりやすいので、極座標を使って、円を8分割して1日の風向きのグラフを表示します 各パーツは風向きを表し、半径は平均風速を表す
def wind_radar(data):
	"""Wind radar graph"""
	wind = list(data['wind_direction'])
	wind_speed = list(data['wind level'])
	for i in range(0,24):
		if wind[i] == "north wind":
			wind[i] = 90
		elif wind[i] == "south wind":
			wind[i] = 270
		elif wind[i] == "westerly":
			wind[i] = 180
		elif wind[i] == "easterly":
			wind[i] = 360
		elif wind[i] == "Northeast wind":
			wind[i] = 45
		elif wind[i] == "Northwest wind":
			wind[i] = 135
		elif wind[i] == "southwest wind":
			wind[i] = 225
		elif wind[i] == "southeasterly":
			wind[i] = 315
	degs = np.range(45,361,45)
	temp = []
	for deg in degs:
		speed = []
		# Get the average wind speed data of wind_deg in the specified range
		for i in range(0,24):
			if wind[i] == deg:
				speed.append(wind_speed[i])
		if len(speed) == 0:
			temp.append(0)
		else:
			temp.append(sum(speed)/len(speed))
	print(temp)
	N = 8
	theta = np.range(0.+np.pi/8,2*np.pi+np.pi/8,2*np.pi/8)
	# Data polar diameter
	radii = np.array(temp)
	# Plot the coordinate system of the polar plot
	plt.axes(polar=True)
	# Define the RGB values (R,G,B) for each sector, the larger the x, the closer to blue the corresponding color is
	colors = [(1-x/max(temp), 1-x/max(temp),0.6) for x in radii]
	plt.bar(theta,radii,width=(2*np.pi/N),bottom=0.0,colors=colors)
	plt.title('Henan Wind Level Chart - Dragon Junior',x=0.2,fontsize=16)
	plt.show()
結果は次のようになります。
観測では、この日が最も北東の風が強く、平均風速は1.75でした。
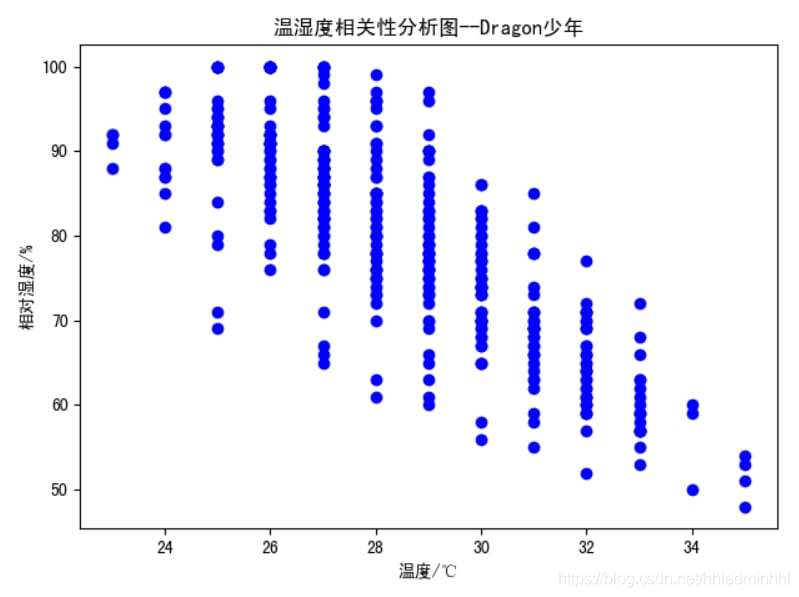
3. 温湿度相関解析
温度と湿度に関係があるかどうかを分析し、より明確かつ直感的に検証するためには 離散点 plt.scatter() メソッド プロット中の各瞬間の気温を横座標、湿度を縦座標で指し示し、相関係数を計算する。
def calc_corr(a, b):
	"""Calculate the correlation coefficient"""
	a_avg = sum(a)/len(a)
	b_avg = sum(b)/len(b)
	cov_ab = sum([(x - a_avg)*(y - b_avg) for x,y in zip(a, b)])
	sq = math.sqrt(sum([(x - a_avg)**2 for x in a])*sum([(x - b_avg)**2 for x in b]))
	corr_factor = cov_ab/sq
	return corr_factor


def corr_tem_hum(data):
	"""Temperature and humidity correlation analysis"""
	tem = data['temperature']
	hum = data['relative humidity']
	plt.scatter(tem,hum,color='blue')
	plt.title("Temperature and humidity correlation analysis graph - Dragon Junior")
	plt.xlabel("Temperature/°C")
	plt.ylabel("Relative Humidity/%")
	# plt.text(20,40,"correlation coefficient is:"+str(calc_corr(tem,hum)),fontdict={'size':'10','color':'red'})
	plt.show()
	print("The correlation coefficient is: "+str(calc_corr(tem,hum)))
結果は次のようになります。
一日を通して温度と湿度に強い相関があることが観察され、次のようなことがわかります。
負の相関
. 気温が低いと空気中に水分が多く含まれ、当然ながら湿度は高くなり、逆に気温が高いと水分が蒸発して空気は乾燥し、湿度は低くなる。
4. 24時間のうち、1時間あたりの降水量
from pyecharts import options as opts
from pyecharts.charts import Map,Timeline
# Define a combined timeline and map map
def timeline_map(data):
    tl = Timeline().add_schema(play_interval =300,height=40,is_rewind_play=False,orientation = "horizontal",is_loop_play = True,is_auto_ play=False)# set the speed of play, whether to loop play and other parameters
    for h in time_line_final:
        x =data[data["hour"]==h]['city'].values.tolist() # select the specified city
        y=data[data["hours"]==h]['precipitation'].values.tolist() #pick the precipitation at the time
        map_shape = (
            Map()
            .add("{}h time precipitation (mm)".format(h),[list(z) for z in zip(x, y)],"Henan") #Package input area and corresponding precipitation data
            .set_series_opts(label_opts=opts.LabelOpts("{b}")) #Configure series parameters, {b} is to display regional data
            .set_global_opts(
                title_opts=opts.TitleOpts(title="Rainfall distribution in Henan Province--Dragon Junior"), # set title in global parameters
                visualmap_opts=opts.VisualMapOpts(max_=300, #Set the maximum value of the mapping configuration item
                                                  is_piecewise=True, # set whether to display in segments
                                                  pos_top = "60%", #the distance from the top of the image
                                                  pieces=[
                                                        {"min": 101, "label": '>100ml', "color": "#FF0000"}, # Specify the color and name of the segment
                                                        {"min": 11, "max": 50, "label": '11-50ml', "color": "#FF3333"},
                                                        {"min": 6, "max": 10, "label": '6-10ml', "color": "#FF9999"},
                                                        {"min": 0.1, "max": 5, "label": '0.1-5ml', "color": "#FFCCCC"}])
        ))
        tl.add(map_shape, "{}h".format(h)) # Add data from different dates to the timeline
    return tl
timeline_map(data).render("rainfall.html")
その効果は次の通りです。
観測では、7月20日にほとんどの地域で雨が降り、20日17時~18時の1時間降水量は201.9mmに達したことがわかる。
4. 24時間累積降水量
from pyecharts import options as opts
from pyecharts.charts import Map,Timeline
# Define a combined timeline and map graph
time_line_final = list(data1['hour'].iloc[0:24])
def timeline_map(data1):
    tl = Timeline().add_schema(play_interval =200,height=40,is_rewind_play=False,orientation = "horizontal",is_loop_play = True,is_auto_ play=True)# set the speed of play, whether to loop play and other parameters
    for h in time_line_final:
        x =data1[data1["hour"]==h]['city'].values.tolist() # select the specified city
        y=data1[data1["hour"]==h]['precipitation'].values.tolist() #pick the precipitation at the time
        map_shape1 = (
            Map()
            .add("{}h time cumulative precipitation (mm)".format(h),[list(z) for z in zip(x, y)],"Henan") #Package input area and corresponding precipitation data
            .set_series_opts(label_opts=opts.LabelOpts("{b}")) #Configure series parameters, {b} is to display regional data
            .set_global_opts(
                title_opts=opts.TitleOpts(title="Cumulative rainfall distribution in Henan Province--Dragon Junior"), # set title in global parameters
                visualmap_opts=opts.VisualMapOpts(max_=300, #Set the maximum value of the mapping configuration item
                                                  is_piecewise=True, # set whether to display in segments
                                                  pos_top = "60%", #the distance from the top of the image
                                                  pieces=[
                                                        {"min": 251, "label": 'Very heavy rain', "color": "#800000"}, # Specify color and name for segment
                                                        {"min": 101, "max": 250, "label": 'Heavy rain', "color": "#FF4500"},
                                                        {"min": 51, "max": 100, "label": 'Heavy rain', "color": "#FF7F50"},
                                                        {"min": 25, "max": 50, "label": 'Heavy rain', "color": "#FFFF00"}, {"min": 25, "max": 50, "label": 'Heavy rain', "color": "#FFFF00"},
                                                        {"min": 10, "max": 25, "label": 'Moderate rain', "color": "#1E90FF"}, {"min": 10, "max": 25, "label": 'Moderate rain', "color": "#1E90FF"},
                                                        {"min": 0.1, "max": 9.9, "label": 'light rain', "color": "#87CEFA"}])
        ))
        tl.add(map_shape1, "{}h".format(h)) # Add data from different dates to the timeline
    return tl
timeline_map(data1).render("rainfalltoall_1.html")
その効果は次の通りです。

これで気象データ解析の可視化は完了です〜。
今日はここまで、明日も頑張ってください

この記事の内容がお役に立ちましたら、トリプルクリック、フォロー、お気に入り登録で応援お願いします。
創作は簡単ではない、白々しいのは良くない、皆さんの応援と評価が私の創作への最大のモチベーションです、また次の記事でお会いしましょう
ドラゴンジュニア|テキスト
このブログの内容に間違いがあれば、ご批判ください!感謝します。
関連
-
undefinedAttributeError: 'dict_values' オブジェクトに 'translate' 属性がない エラーは解決されました。
-
[Python] error could not broadcast input array from shape (26) into shape (26,1)
-
pythonBug:AttributeError: タイプオブジェクト 'datetime.datetime' は属性 'datetime' を持たない。
-
Solve ImportError: cannot import name 'np_utils' from 'tensorflow.keras.utils'
-
python で word, excel, csv, json ファイルの読み書きをする。
-
Python: pyHook-1.5.1-cp37-cp37m-win_amd64.whl はこのプラットフォームでサポートされたホイールではありません。
-
Python max()関数
-
Python Hashmap/Dictionary 使用ガイド
-
Python error TypeError: 'type' object is not subscriptable
-
パイソン-ユニコード
最新
-
nginxです。[emerg] 0.0.0.0:80 への bind() に失敗しました (98: アドレスは既に使用中です)
-
htmlページでギリシャ文字を使うには
-
ピュアhtml+cssでの要素読み込み効果
-
純粋なhtml + cssで五輪を実現するサンプルコード
-
ナビゲーションバー・ドロップダウンメニューのHTML+CSSサンプルコード
-
タイピング効果を実現するピュアhtml+css
-
htmlの選択ボックスのプレースホルダー作成に関する質問
-
html css3 伸縮しない 画像表示効果
-
トップナビゲーションバーメニュー作成用HTML+CSS
-
html+css 実装 サイバーパンク風ボタン
おすすめ
-
from scipy.interpolate import spline errorImportError: cannot import name 'spline'.
-
Python がエラー xxx.whl はこのプラットフォームでサポートされているホイールではありませんと報告します。
-
Python Numpyのarrayarrayとmatrixmatrix
-
pip AttributeError: 'module' オブジェクトには 'SSL_ST_INIT' という属性がありません。
-
ModuleNotFoundError: ConfigParser' という名前のモジュールはありません。
-
Pythonエラー解決] 'urllib2'という名前のモジュールがない解決方法
-
Pythonでフォルダをトラバースして大きなファイルを探す
-
ガールフレンドが深夜12時に彼女をベッドに急がせるよう頼んだが、私はそれをしないパイソンを持っています。
-
Python2.7のエンコード問題:UnicodeDecodeError: 'ascii' codec can't decode byte 0xe8 in position... 解決方法
-
pygalマッピング "AttributeError: 'NoneType' オブジェクトには 'decode' という属性がありません"