[解決済み] LaTexエラー:単位(pt挿入) [終了しました。]
質問内容
LaTexでこの問題に遭遇しました。エラーメッセージの意味はわかるのですが、私のタスクでこのエラーをどのように解決すればよいのか見当がつきません。
\newcommand*{\MinNumber}{0}%
\newcommand*{\MaxNumber}{1.2}%
\pgfmathsetmacro{\MidNumber}{(0.8}%
\def\test#1{\ifdim#1pt>\MidNumber\textcolor{gray!70}{#1}\else{#1}\fi}
\newcommand{\ApplyGradient}[2]{\centering %
\pgfmathsetmacro{\PercentColor}{100.0*(#1-\MinNumber)/(\MaxNumber-\MinNumber)}%
\edef\x{\noexpand\cellcolor{black!\PercentColor}}\x\test{#1}
}
\newcolumntype{R}{>{\collectcell\ApplyGradient}p{1.1cm}<{\endcollectcell}}
\newcolumntype{S}{>{\collectcell\ApplyGradient}p{0.6cm}<{\endcollectcell}}
%
\begin{table}[!ht]
\centering
\small
% \renewcommand{\arraystretch}{0.9}
% \begin{adjustbox}{width=0.8\textwidth}
\begin{tabular}{>{\centering}p{1.3cm}|>{\centering}p{0.9cm}|R R R R R }
\multicolumn{2}{c}{testing in$\rightarrow$}& \multicolumn{1}{c} {$\ang{40}$} & \multicolumn{1}{c} {$\ang{20}$} & \multicolumn{1}{c} {$\ang{0}$} & \multicolumn{1}{c} {$-\ang{20}$} & \multicolumn{1}{c} {$-\ang{40}$} \\ \midrule
& $\ang{40}$ & 0.52 & 0.44 & 0.27 & 0.10 & -0.01 \\
& $\ang{20}$ & 0.47 & 0.49 & 0.35 & 0.19 & 0.07 \\
spider9 & $\ang{0}$ & 0.25 & 0.47 & 0.63 & 0.46 & 0.24 \\
& $-\ang{20}$ & 0.05 & 0.17 & 0.35 & 0.55 & 0.54 \\
& $-\ang{40}$ & 0.0 & 0.05 & 0.21 & 0.47 & 0.77 \\
\midrule
& $\ang{40}$ & 0.75 & 0.69 & 0.40 & 0.17 & 0.04 \\
& $\ang{20}$ & 0.72 & 0.82 & 0.59 & 0.30 & 0.10 \\
gecko7 & $\ang{0}$ & 0.31 & 0.65 & 1.06 & 0.96 & 0.56 \\
& $-\ang{20}$ & 0.16 & 0.45 & 0.86 & 1.18 & 0.98 \\
& $-\ang{40}$ & 0.03 & 0.15 & 0.40 & 0.74 & 0.96 \\
\midrule
& $\ang{40}$ & 1.09 & 0.75 & 0.39 & 0.14 & 0.02 \\
& $\ang{20}$ & 0.54 & 0.55 & 0.33 & 0.15 & 0.04 \\
babyA & $\ang{0}$ & 0.29 & 0.58 & 0.88 & 0.74 & 0.42 \\
& $-\ang{20}$ & 0.18 & 0.47 & 0.85 & 1.09 & 0.71 \\
& $-\ang{40}$ & 0.02 & 0.11 & 0.33 & 0.65 & 0.91 \\
\bottomrule
\end{tabular}
%
\begin{tabular}{p{0.4cm} S}
& 0.0 \\
& 0.1 \\
& 0.2 \\
& 0.3 \\
& 0.4 \\
& 0.5 \\
& 0.6 \\
& 0.7 \\
& 0.8 \\
& 0.9 \\
& 1.0 \\
& 1.1 \\
& 1.2 \\
\end{tabular}
% \end{adjustbox}
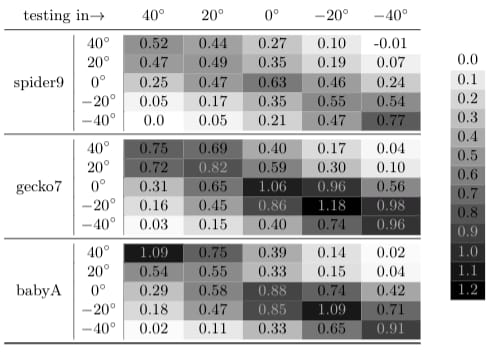
\caption{Robustness of the top learned controllers for different directions in the real world.
The data shows the fitness that the top controllers of three robots in 5 directions (the second column) perform in another directions (the first row).
The fitness value in a cell is averaged over three controller and three repetitions for each controller.
The dark and light color represent the high and low fitness value respectively.}
\label{tab:robustness}
\end{table}
表は写真のように表示されます。
というようなエラーがたくさん出てしまいました。
不正な単位(ptが挿入されている)。
\୧⃛(๑⃙⃘◡̈๑⃙⃘) l.1545 & $ang{40}$ & 0.52 & 0.44 & 0.27 & 0.10 & -0.01 \. 寸法は、em、ex、in、pt、pcの単位を使用できます。 cm, mm, dd, cc, nd, nc, bp, sp のどれでもいいのですが、あなたのは新しいですね! プリンターズポイントはptと言いたかったのでしょう。 このエラーからうまく立ち直るには、次のような方法があります。 誤った単位を削除する。例えば、`2'と入力すると削除される。 の2文字です。(『The TeXbook』27章参照)。
! 不正な単位(ptが挿入されている)です。 \┣︎┣︎┣︎┣︎┣︎┣︎┣︎ଘ L.1545 ... & $THANG{40}$ & 0.52 & 0.44 &.L.1545 ... & $THANG{40}$ & 0.52 & 0.44 & 0.27 & 0.10 & -0.01 \. 寸法は、em、ex、in、pt、pcの単位を使用できます。 cm, mm, dd, cc, nd, nc, bp, sp のどれでもいいのですが、あなたのは新しいですね! プリンターズポイントはptと言いたかったのでしょう。 このエラーからうまく立ち直るには、次のような方法があります。 誤った単位を削除する。例えば、`2'と入力すると削除される。 の2文字です。(『The TeXbook』27章参照)。
この問題を解決するための手を教えてください。ありがとうございます。
どのように解決するのですか?
以下は、その検討内容です。
-
一方
\MinNumberは、以下のように定義されています。0の場合、表中の数字より小さい数字があることになります(-0.01). -
に対してテストを実行する場合
dimエンシオン (\ifdim <dimA><relation><dimB>) の両方を確認する必要があります。<dimA>と<dimB>は寸法です。あなたの場合は\ifdim#1pt>\MidNumberと
\MidNumberは明らかに次元ではありません。これは単なる数字です (0.8). これが問題の主な原因です。 -
\ApplyGradientは2つではなく、1つの引数を取る必要があります。 -
を使うのは気が引ける。
booktabsを縦書きルールと一緒にtabular. 私は出力にそれらを残しましたが、あなたはそれらを必要としません。
\documentclass{article}
\usepackage[margin=1in]{geometry}% Just for this example
\usepackage[table]{xcolor}
\usepackage{booktabs,collcell,xfp}
\newcommand*{\ang}[2]{#1^\circ}
\newcommand*{\MinNumber}{-0.01}%
\newcommand*{\MaxNumber}{1.2}%
\newcommand*{\MidNumber}{0.8}%
\newcommand{\test}[2]{\ifdim#1pt>\MidNumber pt\textcolor{gray!70}{#1}\else #1\fi}
\newcommand{\ApplyGradient}[2]{\centering %
\edef\x{\noexpand\cellcolor{black!\fpeval{100*(#1-\MinNumber)/(\MaxNumber-\MinNumber)}}}\x\test{#1}
}
\newcolumntype{R}{>{\collectcell\ApplyGradient}p{1.1cm}<{\endcollectcell}}
\newcolumntype{S}{>{\collectcell\ApplyGradient}p{0.6cm}<{\endcollectcell}}
%
\begin{document}
\begin{table}
\centering
\begin{tabular}{
>{\centering}p{1.3cm} |
>{\centering}p{0.9cm} |
*{5}{R}
}
\multicolumn{2}{c}{testing in$\rightarrow$} &
\multicolumn{1}{c}{$\ang{40}$} &
\multicolumn{1}{c}{$\ang{20}$} &
\multicolumn{1}{c}{$\ang{0}$} &
\multicolumn{1}{c}{$-\ang{20}$} &
\multicolumn{1}{c}{$-\ang{40}$} \\
\midrule
& $\ang{40}$ & 0.52 & 0.44 & 0.27 & 0.10 & -0.01 \\
& $\ang{20}$ & 0.47 & 0.49 & 0.35 & 0.19 & 0.07 \\
spider9 & $\ang{0}$ & 0.25 & 0.47 & 0.63 & 0.46 & 0.24 \\
& $-\ang{20}$ & 0.05 & 0.17 & 0.35 & 0.55 & 0.54 \\
& $-\ang{40}$ & 0.0 & 0.05 & 0.21 & 0.47 & 0.77 \\
\midrule
& $\ang{40}$ & 0.75 & 0.69 & 0.40 & 0.17 & 0.04 \\
& $\ang{20}$ & 0.72 & 0.82 & 0.59 & 0.30 & 0.10 \\
gecko7 & $\ang{0}$ & 0.31 & 0.65 & 1.06 & 0.96 & 0.56 \\
& $-\ang{20}$ & 0.16 & 0.45 & 0.86 & 1.18 & 0.98 \\
& $-\ang{40}$ & 0.03 & 0.15 & 0.40 & 0.74 & 0.96 \\
\midrule
& $\ang{40}$ & 1.09 & 0.75 & 0.39 & 0.14 & 0.02 \\
& $\ang{20}$ & 0.54 & 0.55 & 0.33 & 0.15 & 0.04 \\
babyA & $\ang{0}$ & 0.29 & 0.58 & 0.88 & 0.74 & 0.42 \\
& $-\ang{20}$ & 0.18 & 0.47 & 0.85 & 1.09 & 0.71 \\
& $-\ang{40}$ & 0.02 & 0.11 & 0.33 & 0.65 & 0.91 \\
\bottomrule
\end{tabular}
\hspace{4mm}
\begin{tabular}{ S }
0.0 \\ 0.1 \\ 0.2 \\ 0.3 \\ 0.4 \\ 0.5 \\
0.6 \\ 0.7 \\ 0.8 \\ 0.9 \\ 1.0 \\ 1.1 \\
1.2
\end{tabular}
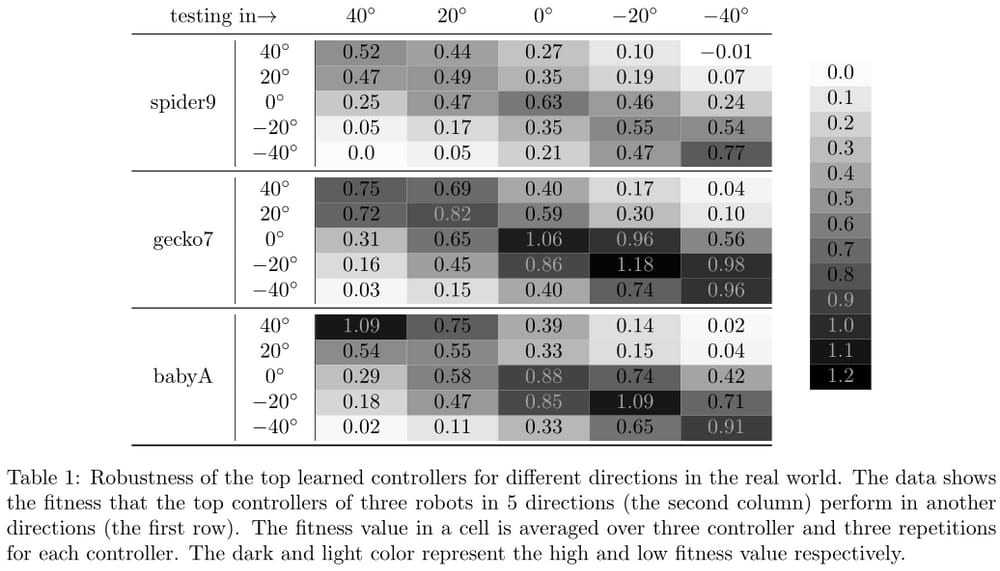
\caption{Robustness of the top learned controllers for different directions in the real world.
The data shows the fitness that the top controllers of three robots in~5 directions (the second column) perform in another directions (the first row).
The fitness value in a cell is averaged over three controller and three repetitions for each controller.
The dark and light color represent the high and low fitness value respectively.}
\end{table}
\end{document}
関連
-
[解決済み】LaTeXで "Missing $ inserted "というエラーが発生する。
-
[解決済み】LaTeXで変数を定義する方法はありますか?
-
[解決済み] アラインメントタブ文字と
-
[解決済み] LaTeXでPDFファイルを挿入する
-
[解決済み] LaTeXの表でテキストを折り返すには?
-
[解決済み] このLaTeX文書にインデントでコードを挿入する
-
[解決済み] LaTeXでドキュメントのフォントを変更するには?
-
[解決済み] 専門書のようなLaTeXのソースコード一覧表示
-
[解決済み】IPython NotebookでLaTeXを記述する方法は?
-
[解決済み】git + LaTeX ワークフロー
最新
-
nginxです。[emerg] 0.0.0.0:80 への bind() に失敗しました (98: アドレスは既に使用中です)
-
htmlページでギリシャ文字を使うには
-
ピュアhtml+cssでの要素読み込み効果
-
純粋なhtml + cssで五輪を実現するサンプルコード
-
ナビゲーションバー・ドロップダウンメニューのHTML+CSSサンプルコード
-
タイピング効果を実現するピュアhtml+css
-
htmlの選択ボックスのプレースホルダー作成に関する質問
-
html css3 伸縮しない 画像表示効果
-
トップナビゲーションバーメニュー作成用HTML+CSS
-
html+css 実装 サイバーパンク風ボタン
おすすめ
-
[解決済み】LaTeXでタイムラインを作成する方法とは?
-
VScode+Latexの設定(Recipe terminated with fatal error: spawn xelatex ENOENT)
-
[解決済み] アラインメントタブ文字と
-
Latexがエラーを報告する $ inserted.insertテキストがない
-
ラテックス ! 挿入された \endcsname が欠落しています。
-
[解決済み] latexで&&を入力するにはどうすればよいですか?
-
[解決済み] LaTeX-syntaxを使った電卓はありますか?
-
[解決済み] 数式中の中括弧の隣にある2つのステートメント
-
[解決済み] LaTeX。テキストスパンでの改行を防止する
-
[解決済み] Pandoc マークダウン ページブレーク